Version 1.6.7 news
Lots of new features coming up with version 1.6.x of our app. You can now track your dividends, check how your assets have been performing and check your allocation. Let’s examine each of these in more detail.
Dividend tracking
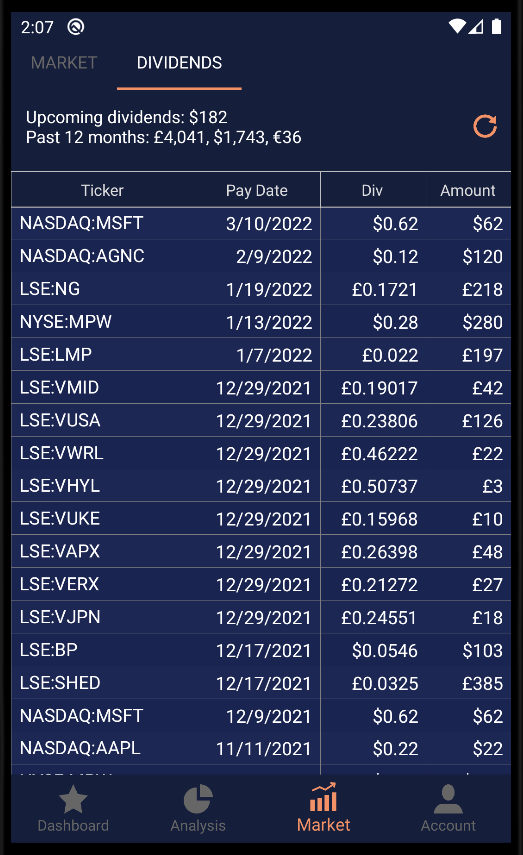
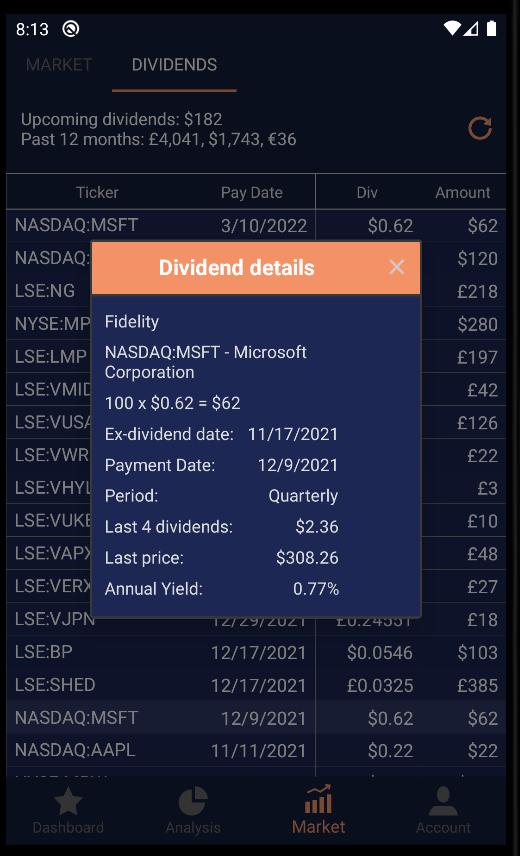
Track the dividends payments you have received based on the amount of your holdings at the time of distribution. Can also see upcoming dividends and get a summary of past 12 months. Click on a row to see more details
Allocation view
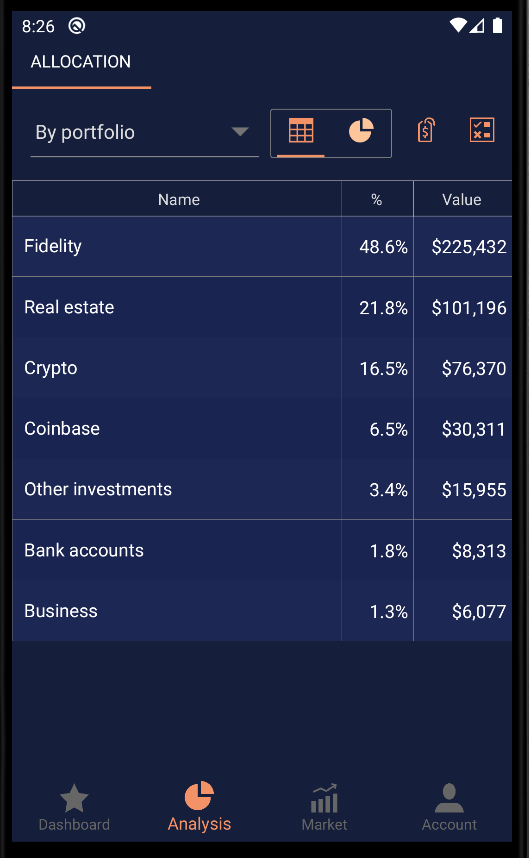
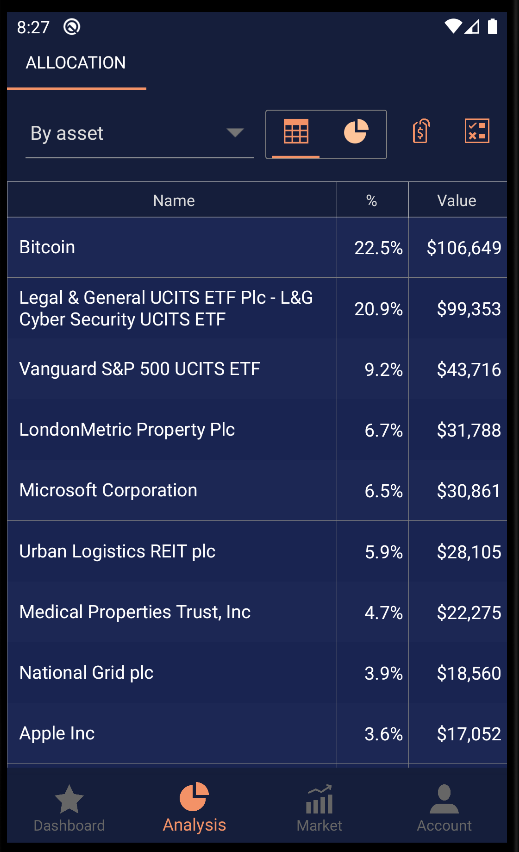
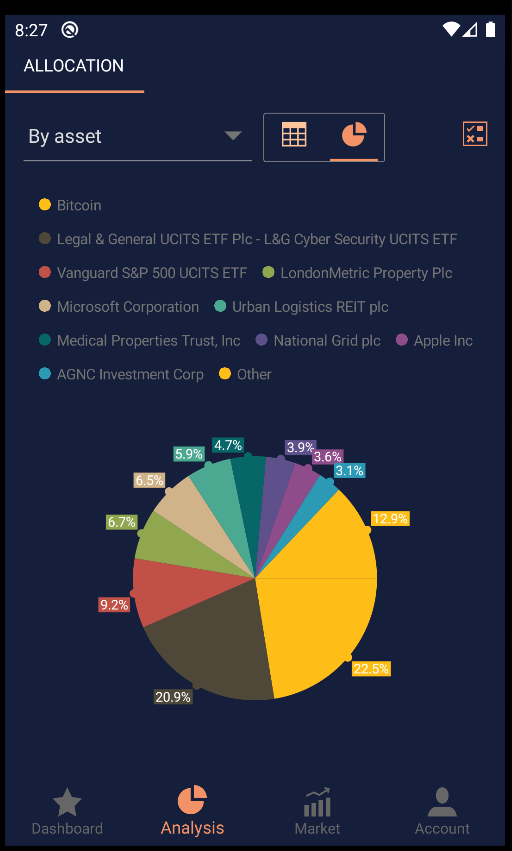
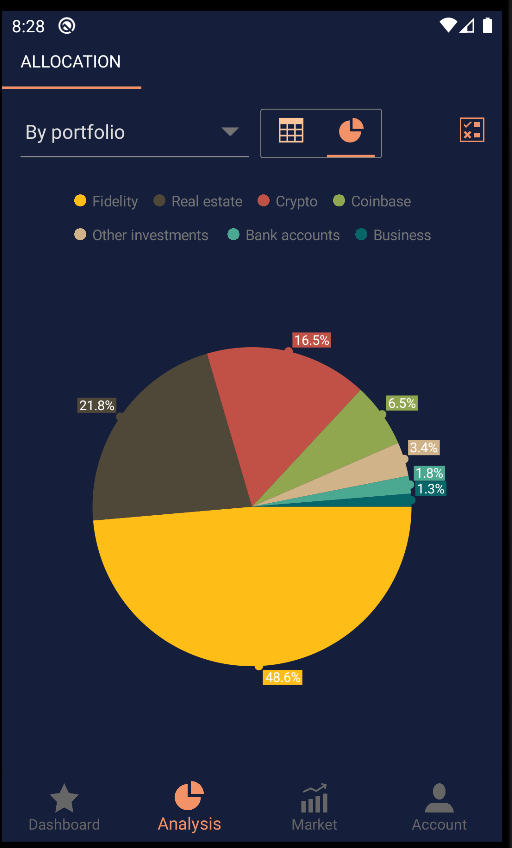
Ever wondered how much your net worth is split between your portfolios? Or how much each asset makes up in your portfolio? Enter our new allocation view screen.
 You can view the the allocation as a pie chart, or as a list.
![]() You have the option to hide the prices from the list view and view just the percentages. This is useful if you want to take a screenshot of your holdings to compare how much you have allocated on each asset to share it and compare with your friends, without revealing the amount of each holding.
You have the option to hide the prices from the list view and view just the percentages. This is useful if you want to take a screenshot of your holdings to compare how much you have allocated on each asset to share it and compare with your friends, without revealing the amount of each holding.
![]() Allows you to select which portfolios you want to include in the allocation view. For example you might want to see all your stocks in one view, so see the breakdown of your equity portfolio, but don’t want to include your real estate assets or car in that view. By default it’s on auto mode – you will see only the portfolios that are included in your net worth.
Allows you to select which portfolios you want to include in the allocation view. For example you might want to see all your stocks in one view, so see the breakdown of your equity portfolio, but don’t want to include your real estate assets or car in that view. By default it’s on auto mode – you will see only the portfolios that are included in your net worth.
Market view
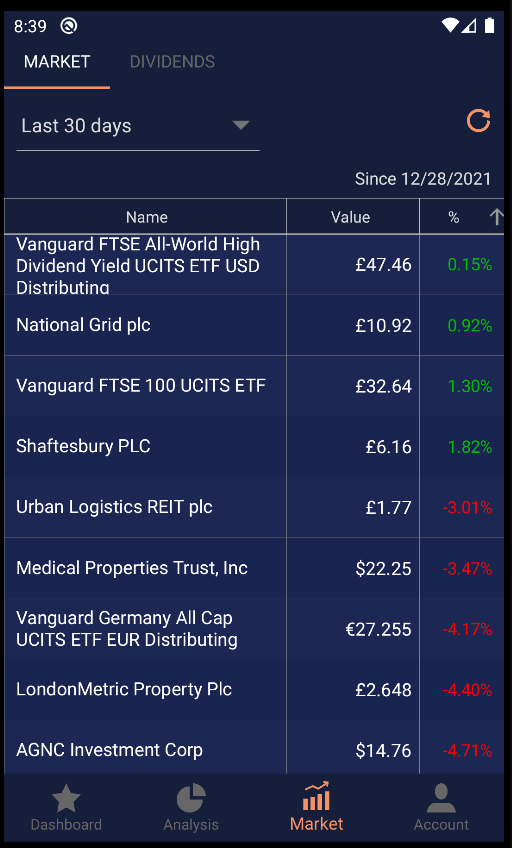
Want to see how your assets have done over last week or last month? Choose the term of interest (from intraday to last 365 days) and see the move for all your assets. Intraday view requires intraday data, so you will need to either be a premium subscriber or watch an ad to fetch this data.
If you have any comments, request or questions about any of these features please let us know within the app.

